TikTok Shop Profit Margin Calculator: Why Generic E-Commerce Math Fails on Social Commerce
Standard e-commerce math fails on TikTok Shop. Most calculators use a basic "Price minus COGS" formula that works for Shopify but ignores the aggressive fee structure and high-velocity costs unique to social commerce.
The problem isn't poor design. These tools are built for a different business model. TikTok Shop operates on a different cost structure than traditional DTC. Plugging your numbers into a generic margin calculator will give you a number that looks profitable on screen but evaporates by the time your payout hits.
The Real Cost Structure
TikTok Shop's fee structure, high return rates, and affiliate ecosystem create hidden costs that generic calculators miss. Most sellers operate on razor-thin or negative margins because they're not accounting for platform fees calculated on gross sales, sample waste, creator commissions, and impulse-driven return rates that exceed traditional channels.
Building an accurate profit model requires tracking five cost categories and updating assumptions with real operational data—not industry averages.
Platform fees are 8% (not 2-5%) and are calculated on gross sales including tax and shipping, not just product price.
Affiliate commissions vary by creator tier (10-25%) and sample waste runs 20-30%, making true acquisition costs 33% higher than most projections.
Return rates on TikTok are 5-12% due to impulse buying behavior, requiring a dedicated reserve that most calculators ignore.
Paid amplification creates a "double dip" where you pay both the ad cost AND the affiliate commission on the same sale.
Viral scaling without proper margin modeling can bankrupt a brand. A 10,000-unit spike can turn profitable products into cash incinerators if margins are miscalculated.
The Danger of Unprofitable Scaling
Viral growth on TikTok is a double-edged sword. If your margins are thin, a video that generates 10,000 orders in 48 hours can bankrupt a brand.
This happens more often than anyone admits. A creator posts, the algorithm picks it up, and you're fulfilling orders around the clock. The Seller Center shows impressive revenue numbers. Your team celebrates. Then the settlement report arrives, and you realize you lost $2.50 on every unit shipped.
The costs stack up fast: sample shipping to creators who never posted, affiliate payouts calculated on gross (not net), platform fee increases that went unnoticed, and return rates that ran 3x higher than your projections. Each one seems small. Together, they turn a winning product into a cash incinerator.
Top Line vs. Bottom Line
TikTok Shop reports "Gross Revenue" prominently in the Seller Center. This number is a vanity metric.
It doesn't account for the 8% referral fee. It doesn't subtract the cost of samples you sent to 500 creators. It doesn't reflect the 18% commission you agreed to pay that mid-tier influencer who drove most of your sales.
To build a sustainable business, you need to calculate Contribution Margin—the actual cash left to cover your overhead after every variable cost is paid.
The 5 Cost Categories You Must Track
To build an accurate calculator, you must account for five cost categories. Ignoring even one will result in a projected profit that disappears somewhere between the order confirmation and your bank statement.
Platform & Transaction Fees
As of July 2024, TikTok increased its referral fee to 8% for most categories. This is a jump from the introductory 2% rates that attracted early adopters.
Referral fees are fixed percentages based on your product category. Some categories run higher. Check your specific vertical—assuming 8% across the board can leave you exposed if you're selling in a 10% category.
Transaction fees cover payment processing costs. These are smaller but still eat into margin.
The calculation catches many sellers off guard. These fees are calculated on the gross sales price, including taxes and sometimes shipping, depending on your nexus situation. If you're calculating 8% of your product price alone, you're underestimating.
A $30 product with $5 shipping and $2.80 in tax might generate a referral fee closer to $3.02 than the $2.40 you budgeted. That $0.62 difference adds up across thousands of orders.
The Affiliate Ecosystem
Affiliates are the engine of TikTok Shop. They're also expensive.
Tiered commissions vary widely. While 10% is cited as a baseline, top-tier creators demand 15-25%. Some won't even open your package for less than 20%. If your margin model assumes 10% across the board, you're either working with bottom-tier creators or underestimating costs.
Sample logistics extend beyond COGS. You're not just losing the cost of the product—you're paying $8-15 to ship it to the creator. For a $6 COGS item, the sample actually costs you $14-21 when shipping is included.
The ghost rate is the number no one talks about. Roughly 20-30% of samples sent never result in a posted video. The creator received your product, maybe tried it, and moved on. This lost inventory must be baked into your margin as a marketing expense.
If you send 100 samples and 25 never convert to content, you need to spread that cost across the 75 videos that do get posted. Your effective sample cost per video just increased by 33%.
Fulfillment and Returns
TikTok is a high-impulse environment. Someone watches a 30-second video, taps "Buy," and receives a product they barely remember ordering. This leads to higher return rates than traditional search-based shopping.
The 5-12% buffer depends on your category. Apparel runs high—sometimes 15% or more. Hard goods and consumables trend lower. Set aside a 10% reserve for returns as a starting point, then adjust based on your actual data.
Shipping models create different risk profiles. "Ship by TikTok" vs. "Ship by Seller" changes your liability and cost structure. TikTok's automated shipping subsidies can fluctuate, and if you lose eligibility due to performance issues, your margins can swing by $3-$7 per unit instantly.
Paid Media
Organic reach is rarely enough to sustain a brand past the initial phase. Spark Ads—boosting creator content—are necessary for predictable revenue.
Breakeven ROAS is the number you need to know cold. What Return on Ad Spend do you require to stay profitable after paying the affiliate, the platform, and covering fulfillment? For many brands, this number is higher than they expect. A 3x ROAS that would be profitable on Meta might be break-even on TikTok Shop once affiliate commissions are factored in.
The double dip trips up brands new to the platform. If you run a Spark Ad on an affiliate video, you're paying for the ad click and the affiliate commission on the resulting sale. That 15% commission doesn't disappear because you also spent money driving traffic.
A $30 product with a $5 ad cost and a 15% affiliate commission means you're paying $9.50 in acquisition costs before platform fees, COGS, or shipping enter the equation.
Inventory and Viral Spikes
Scaling requires capital. What's less obvious is how TikTok's velocity can create cash flow crises even for successful products.
If a product goes viral, you may need to air-freight inventory to keep the "Buy" button active. Going out of stock tanks your shop health score, suppresses future visibility, and can take weeks to recover.
Air-freight can eat 20-40% of your margin on that inventory batch. A profitable run turns into a break-even event just to maintain your shop's health rating. You made money on paper but spent it all keeping the lights on.
The alternative—letting the product go out of stock—might be worse. You need to model both scenarios before the video goes viral, not after.
Calculating Your True Net Profit
Use this framework to build your internal spreadsheet. Do not skip the "Return Reserve" or "Sample Loss" line items because they're inconvenient. They're real costs whether you track them or not.
The Master Formula
Net Profit = Price - (COGS + Platform Fee + Shipping + Affiliate Commission + Ad Spend + Sample Allocation + Return Reserve)
Each component must be calculated accurately. Estimates and "close enough" numbers compound into significant errors at scale.
Practical Example: $30 Beauty Product
Here's how the math works for a mid-range beauty SKU:
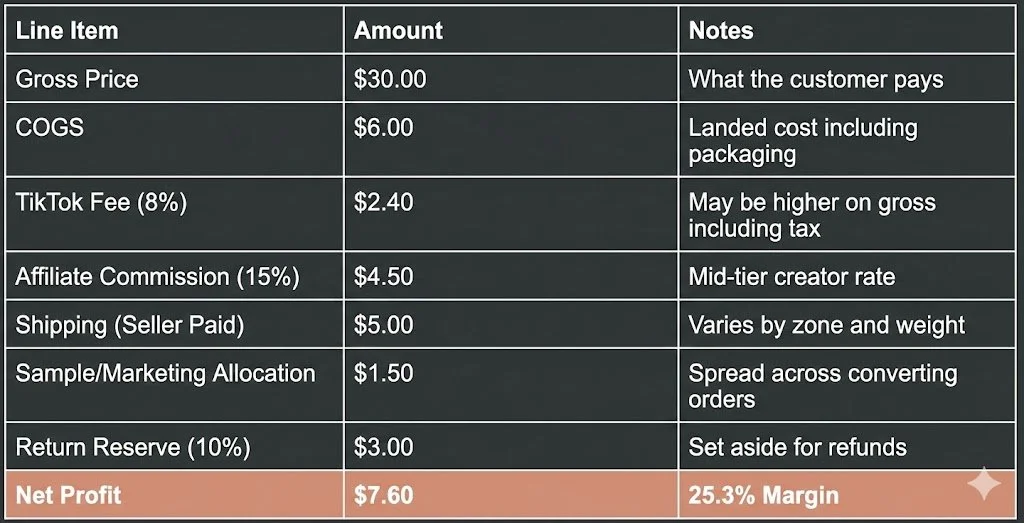
A 25% margin looks healthy. But notice how quickly it erodes if any single variable shifts:
Affiliate demands 20% instead of 15%: Margin drops to 23.6%
Return rate hits 15%: Margin drops to 23.6%
Both happen simultaneously: Margin drops to 21.9%
Add a $3 Spark Ad cost per unit: Margin drops to 11.9%
You're operating on thin ice.
Identifying the Leak
If your Net Profit is below 15% after these calculations, you're one bad batch of returns or one shipping price hike away from losing money.
The most common leaks:
Underestimating affiliate rates by using "target" commissions instead of actual weighted averages
Ignoring sample waste because it feels like marketing, not COGS
Using historical return rates from other channels that don't reflect TikTok's impulse-buy behavior
Calculating platform fees on net price instead of gross
Each leak seems minor. A half-percent here, a dollar there. Together they can represent the difference between a profitable channel and an expensive experiment.
Operational Systems for Scale
A calculator tells you where you are. A strategy tells you where to go. Once the math is clear, the focus shifts to operational execution that protects and expands those margins.
Performance-Driven Commission Modeling
Don't offer a flat commission across your entire shop. Use your calculator to set specific rates for different SKUs based on their margin capacity.
High-margin items can afford a 20% commission to attract top creators. If you're making 40% margin before affiliate costs, paying 20% to a creator who can move 5,000 units is a good trade.
Low-margin products should stay at 5-8% to drive shop traffic without draining cash. These products exist to get customers into your ecosystem, not to generate profit directly.
Mid-tier products require the most careful calibration. Run the numbers at 10%, 15%, and 20% commission rates. Know exactly where your breakeven sits and set your Open Collaboration rate accordingly.
From Experiment to Revenue Channel
Many brands treat TikTok Shop as a "test." They allocate minimal resources, accept inconsistent results, and wonder why the channel never scales.
The platform rewards consistency and shop health. Sporadic fulfillment, stockouts, and slow shipping times suppress your visibility in ways that take months to recover.
Operations and fulfillment need to scale with demand. If your warehouse can handle 5 orders a day but struggles at 500, you'll fail exactly when you succeed. The viral moment becomes an operational crisis instead of a growth inflection point.
Strategy and testing should be driven by your profit calculator, not intuition. Use the data to decide which products get the Spark Ad budget. If a SKU can't support paid amplification mathematically, don't run ads on it hoping the volume will somehow fix the margin.
The Operator-Led Approach
Most agencies focus on views. They'll show you impressive reach numbers and engagement rates. These metrics matter for brand awareness. They don't pay invoices.
We focus on the settlement report. The actual money that hits your account after TikTok takes its cut, after affiliates are paid, after returns are processed. That number is the only one that matters for building a sustainable business.
By integrating your profit calculator into daily operations, you move away from unprofitable scaling and toward systematic growth. Every SKU has a known margin. Every creator partnership has a projected ROI. Every ad campaign has a breakeven threshold.
If the math doesn't work on paper, it won't work in the app.
Verification Checklist
Before you launch your next product or scale your current catalog, verify these fundamentals:
Update your referral fee to 8% in all projections. If you're still using 2% or 5% from TikTok's promotional period, your margins are fictional.
Factor in realistic return rates. Use 10% for apparel minimum, 5% for hard goods. Adjust based on your actual data.
Include sample ghosting as a line item in your marketing budget. If 25% of your samples never generate content, that cost needs to live somewhere in your model.
Calculate breakeven ROAS while accounting for the affiliate's cut. A Spark Ad that generates a sale still pays the creator commission.
Review SKU-level performance weekly to adjust commission rates. Products that can't support their current affiliate costs need restructuring or removal from Open Collaboration.
Model your air-freight scenario before you need it. Know exactly what margin you'd have if you had to expedite inventory to meet viral demand.
Track actual vs. projected margins monthly. Your calculator is only as good as the assumptions feeding it. Update those assumptions with real data.
The brands that win on TikTok Shop aren't the ones with the best products or the most viral content. They're the ones who understand their numbers deeply enough to scale without bleeding cash. A proper profit margin calculator isn't a nice-to-have, it's the foundation everything else builds on. To get help with TikTok Shop, please contact us today!